This blog will give you insight on how to setup collection of Performance and ServiceMap information from Linux and Windows devices using Azure Monitor Agent (AMA). This is also referred to as VMInsight.
VM insights collects performance and connection metrics, computer and process inventory data, and health state information and forwards it to the Log Analytics workspace in Azure Monitor.
You can use the data for example when you do migration planning, capacity analysis, discovery, and on-demand performance troubleshooting.
Performance data

ServiceMap

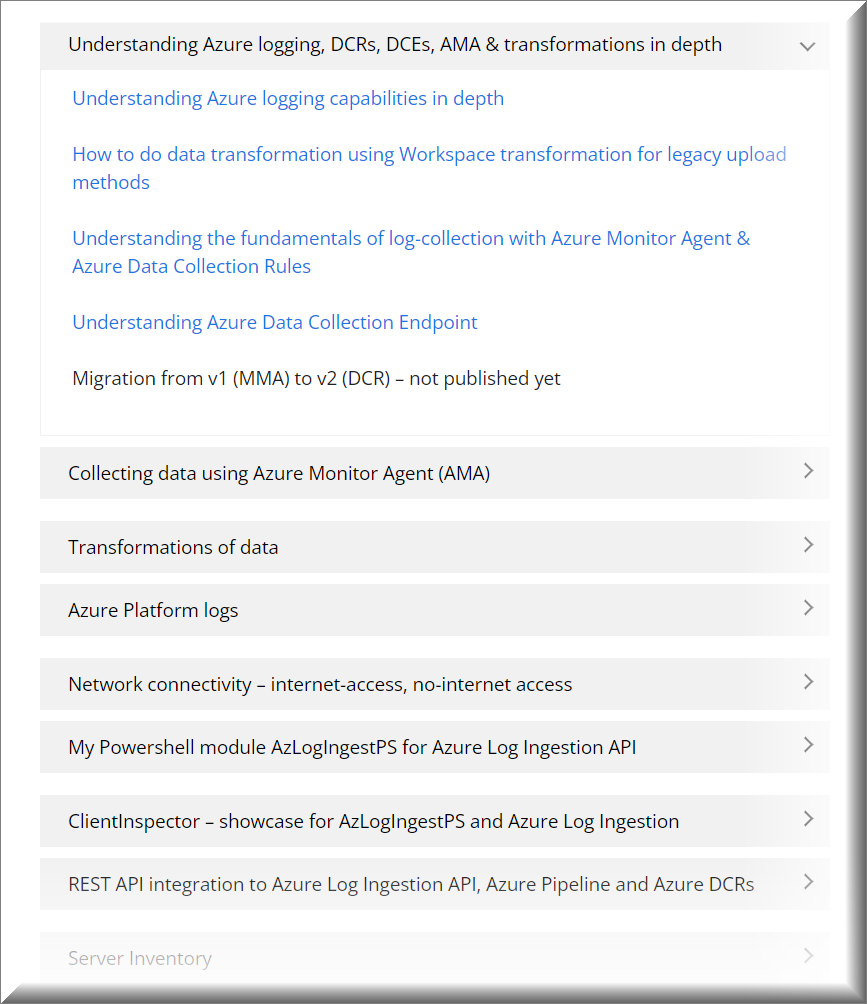
This blog-post is part of a series of blog posts to master Azure logging in depth (overview).
To get you started, you can find ARM-templates & scripts in my AzureLogLibrary (github). Details will be covered in the articles.
Quick Links
How to start collecting performance & service map events using ARM-template ?
How to setup in GUI
High-level architecture / flow
Layout of VMInsight DCR (JSON)
Data transformation
How to start collecting performance & service map events using ARM-template ?
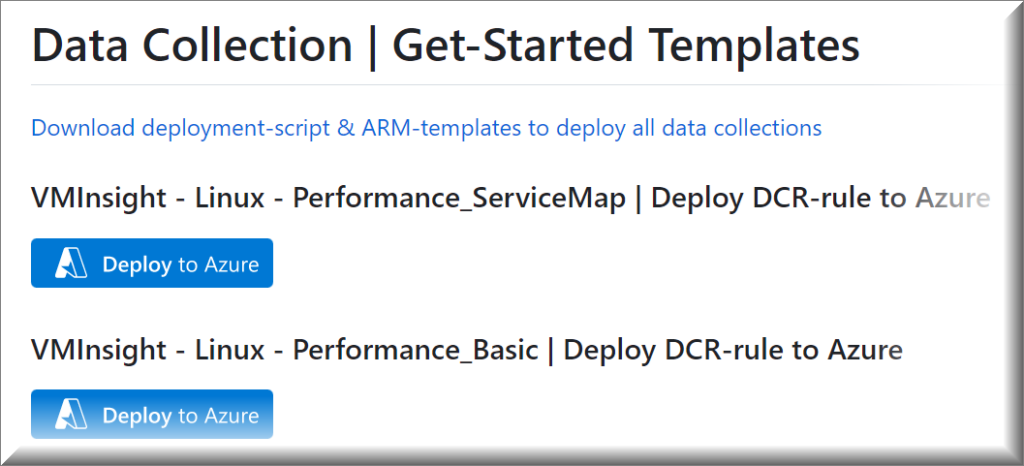
To get you started, I have prepared ARM-templates on my Github
| VMInsight – Windows – Performance_ServiceMap |
| VMInsight – Linux – Performance_ServiceMap |
| VMInsight – Linux – Performance_Basic |
I have also provided more documentation and powershell script to deploy more DCRs
Lastly, I am also providing ‘Deploy to Azure’ shortcuts, based on the mentioned ARM-templates so you can deploy samples into your environment.
VMInsight – Windows – Performance_ServiceMap
VMInsight – Linux – Performance_ServiceMap
VMInsight – Linux – Performance_Basic
How to setup in GUI ?
If you prefer to setup using the GUI, you will only be able to collect basic performance counters – and not servicemap information. Please use the provided ARM-templates to setup a combi-collection – see the previous section.


You don’t need to associate the DCR rule with any resources when you are just setting up the DCR rule. You can do this later.
Some data sources require a data collection endpoint (txt-logs, iis-logs, log ingestion api). This is covered in another blog-post
You can just click Next


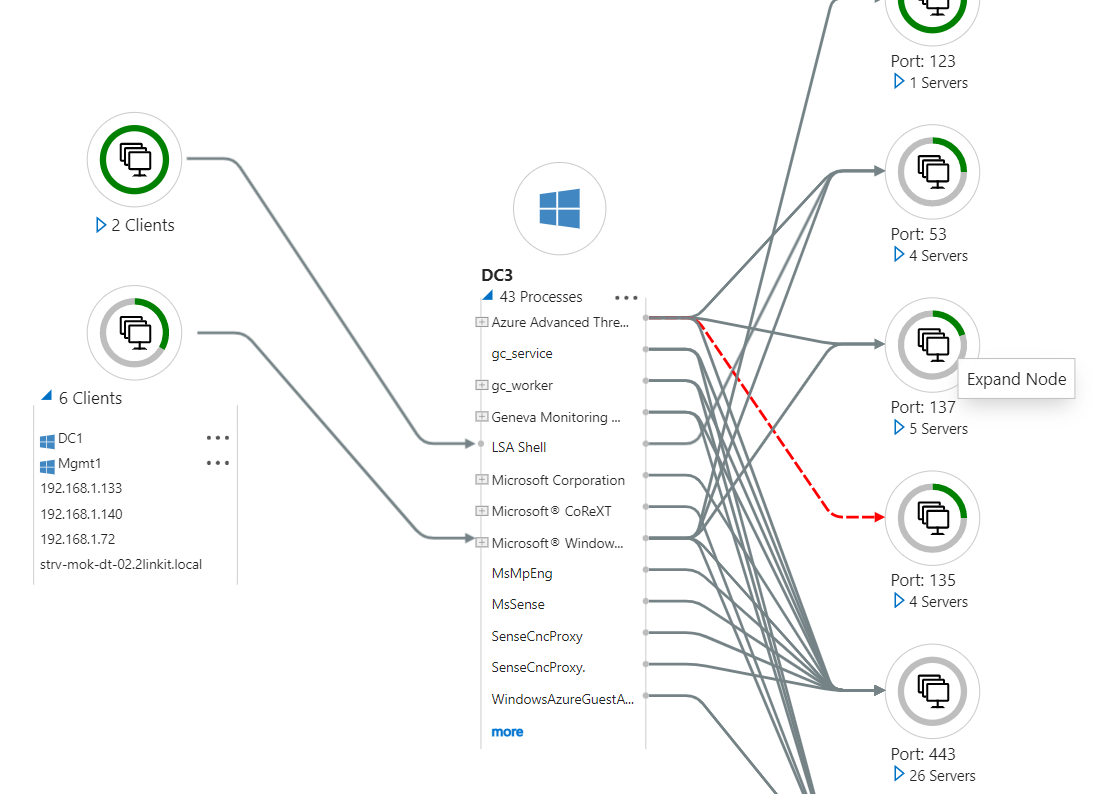
ServiceMap information provides cool features, where you will be able to see which devices are talking with the server – and to which processes. You will see both inbound and outbound traffic.

High-level architecture / flow
Data will be sent into the following Azure LogAnalytics standard tables:
| InsightsMetrics | Performance counters & health state (heartbeat) counters – separated into the following Namespaces: Computer LogicalDisk Network memory Processer |
| VMBound VMConnection | These tables provide information about the connections for a machine (inbound and outbound), as well as the server ports that are open/active on them. ConnectionMetrics are also exposed via APIs that provide the means to obtain a specific metric during a time window. TCP connections resulting from accepting on a listening socket are inbound, while those created by connecting to a given IP and port are outbound. The direction of a connection is represented by the Direction property, which can be set to either inbound or outbound. Records in these tables are generated from data reported by the Dependency Agent. Every record represents an observation over a 1-minute time interval. The TimeGenerated property indicates the start of the time interval. Each record contains information to identify the respective entity, that is, connection or port, as well as metrics associated with that entity. Currently, only network activity that occurs using TCP over IPv4 is reported. |
| VMProcess | Contains all processes and PIDs running on the device |
| VMComputer | Contains detailed information about the device |

Layout of VMInsight DCR (JSON)
DCR contains the following dataSources section, if you want to collect vminsight data.
 "dataSources": {
            "performanceCounters": [
                {
                    "streams": [
                        "Microsoft-InsightsMetrics"
                    ],
                    "samplingFrequencyInSeconds": 60,
                    "counterSpecifiers": [
                        "\\VmInsights\\DetailedMetrics"
                    ],
                    "name": "VMInsightsPerfCounters"
                }
{
    "properties": {
        "description": "Data collection rule for VM Insights.",
        "immutableId": "dcr-f25135f34aba4b3ca04ce623aeace6a1",
        "dataSources": {
            "performanceCounters": [
                {
                    "streams": [
                        "Microsoft-InsightsMetrics"
                    ],
                    "samplingFrequencyInSeconds": 60,
                    "counterSpecifiers": [
                        "\\VmInsights\\DetailedMetrics"
                    ],
                    "name": "VMInsightsPerfCounters"
                }
            ],
            "extensions": [
                {
                    "streams": [
                        "Microsoft-ServiceMap"
                    ],
                    "extensionName": "DependencyAgent",
                    "extensionSettings": {},
                    "name": "DependencyAgentDataSource"
                }
            ]
        },
        "destinations": {
            "logAnalytics": [
                {
                    "workspaceResourceId": "/subscriptions/fce4f282-fcc6-43fb-94d8-bf1701b862c3/resourcegroups/rg-logworkspaces/providers/microsoft.operationalinsights/workspaces/log-platform-management-srvnetworkcloud-p",
                    "workspaceId": "b7d80924-d55d-4bf6-b2b3-9889301c7114",
                    "name": "VMInsightsPerf-Logs-Dest"
                }
            ]
        },
        "dataFlows": [
            {
                "streams": [
                    "Microsoft-InsightsMetrics"
                ],
                "destinations": [
                    "VMInsightsPerf-Logs-Dest"
                ]
            },
            {
                "streams": [
                    "Microsoft-ServiceMap"
                ],
                "destinations": [
                    "VMInsightsPerf-Logs-Dest"
                ]
            }
        ],
        "provisioningState": "Succeeded"
    }
Data transformation
It doesn’t make much sense to do transformation of data related to servicemap or performance data. Instead I would recommend changing the frequency of how often you retrieve the data – by default every 60 sec.
You will manage the frequency using the samplerFrequencyInSeconds
 "samplingFrequencyInSeconds": 60,
                    "counterSpecifiers": [
                        "\\VmInsights\\DetailedMetrics"
1 thought on “Collecting Performance data using Azure Monitor Agent, VMInsights and ServiceMap”